March 14, 2026
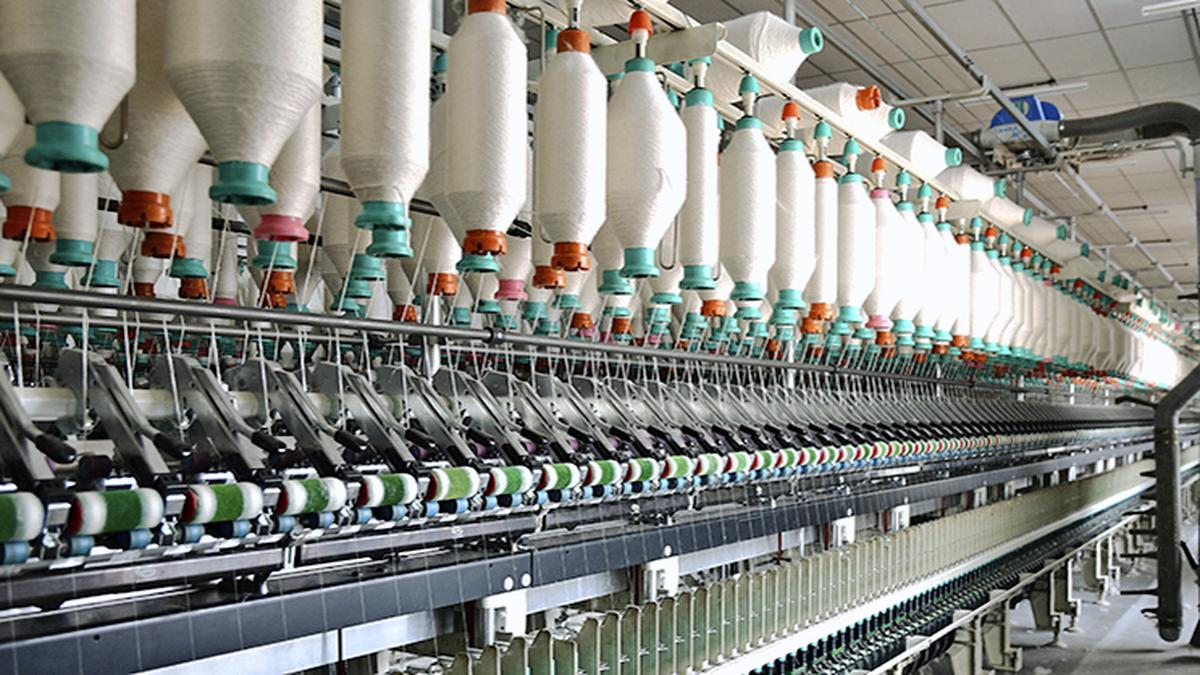
Pakistan’s textile exports decline over 7% to $1.3 billion in February
PBS data shows knitwear exports fell fall 14.5% to $312.5 million, bedwear declines 11.5% to $220.9 million, towels drop 16.37% to $81.4 million, and cotton cloth exports decrease by 10.9% to $132.5 million
March 14, 2026
Pakistan’s textile exports declined to $1.3 billion in February 2026, registering a 7.2 percent decrease year-on-year and a 24.6 percent drop from January, according to data released by the Pakistan Bureau of Statistics (PBS) on Friday.
Exports had stood at $1.738 billion in January, with most major textile categories recording lower shipments during February. Knitwear exports fell 14.5 percent to $312.5 million, while bedwear declined 11.5 percent to $220.9 million. Towels exports dropped 16.37 percent to $81.4 million, and cotton cloth exports decreased 10.9 percent to $132.5 million.
Readymade garment exports also slipped 0.56 percent to $327.3 million compared with the same month last year.
In contrast, cotton yarn exports increased 43.6 percent to $73.84 million during the month.
Food sector exports also recorded a decline, falling 27.5 percent to $405.9 million. Rice exports dropped 35.4 percent to $186.7 million, with basmati shipments declining 19.2 percent to $71.4 million, while exports of other rice varieties decreased 42.5 percent to $115.3 million.
Vegetable exports fell 75.7 percent to $15.15 million, while fruit exports edged up 1.2 percent to $26.9 million. Exports of oilseeds, nuts and kernels increased 40.7 percent to $25.95 million, meat exports rose 22.1 percent to $53.9 million, and fish and fish products increased 12.9 percent to $35.35 million compared with February last year.
Among other sectors, sports goods exports rose 6.6 percent to $33.25 million, driven by a 9.4 percent increase in football shipments to $20 million. Surgical instrument exports declined 6.1 percent to $34 million, while cement exports rose 11.2 percent to $22.2 million.
On the import side, the petroleum group imports declined 21.25 percent year-on-year to $982.8 million in February. Petroleum product imports dropped 39.3 percent to $284 million, LNG imports decreased 25.25 percent to $189 million, and crude oil imports fell 4.55 percent to $423 million, while LPG imports increased 4.1 percent to $86.7 million.
Imports under the machinery group rose 4.3 percent to $870.8 million. Construction and mining machinery imports increased 13.7 percent to $13.6 million, textile machinery 2.6 percent to $46.4 million, and power generation machinery 8.7 percent to $68.1 million. Telecom machinery imports grew 21.1 percent to $211.5 million, including mobile phone imports which rose 17.95 percent to $155.5 million. Agricultural machinery imports increased 74.8 percent to $14 million, while imports of electrical machinery and apparatus declined 40 percent to $184 million.
Food group imports increased 13.6 percent to $908.1 million. Palm oil imports rose 5.3 percent to $385.6 million, and tea imports increased 33.8 percent to $61.4 million, while imports of spices declined 2.1 percent to $22 million and pulses fell 25.5 percent to $71.4 million.
Imports in the transport sector rose 48.8 percent to $299 million. Under the motor vehicle category, imports of completely built units increased 43 percent to $36 million, while CKD/SKD vehicle imports rose 68.5 percent to $157 million, taking total imports in the category to $291 million.
0 Comments
No comments yet. Be the first to join the discussion!