Pakistan’s factory output grows 6.44% in July-April despite 8.32% monthly drop in April
Automobile output rises 64.33% during 10 months, while pharmaceuticals and iron and steel decline 6.55% and 6.98%, respectively
Pakistan’s large-scale manufacturing output increased by 6.44% during the first 10 months of fiscal year 2025-26, supported by higher production of automobiles, food, garments, petroleum products and cement, according to provisional official data released by the Pakistan Bureau of Statistics (PBS).
The Quantum Index of Manufacturing stood at 122.19 during July-April FY26, compared with 114.79 in the corresponding period of the previous fiscal year. The index uses 2015-16 as its base year.
In April alone, large-scale manufacturing output rose by 6.06% year-on-year, with the index increasing to 114.56 from 108.01 in April 2025.
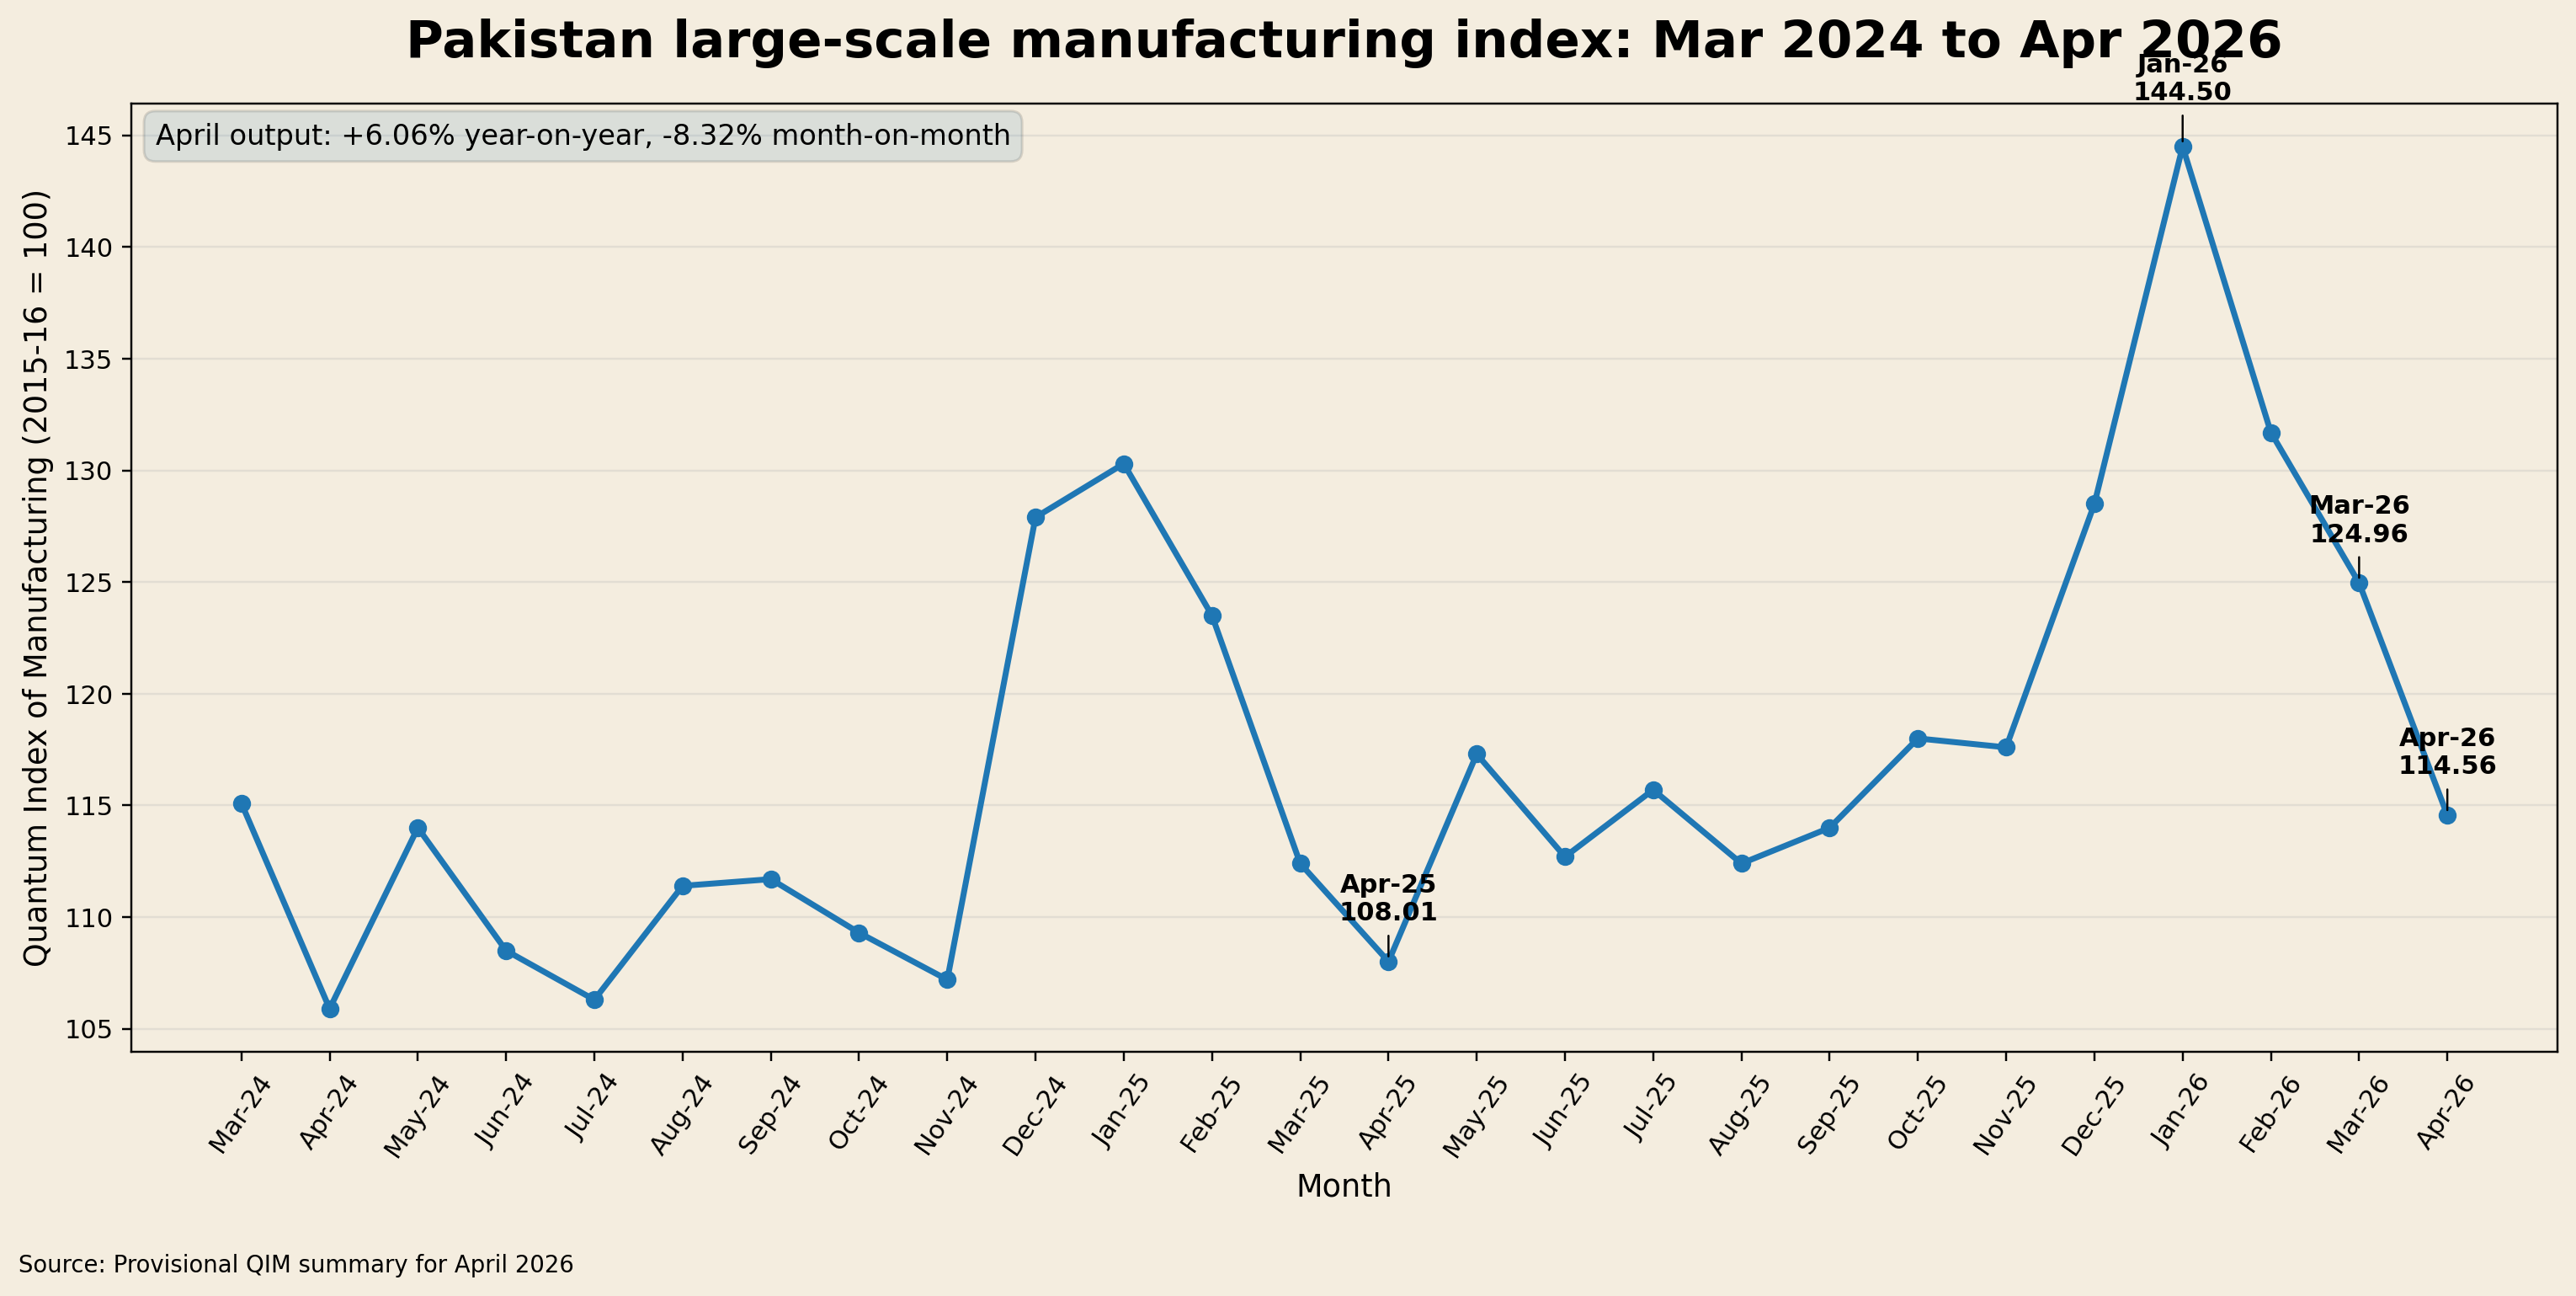
However, production declined by 8.32% compared with March 2026, when the index stood at 124.96.
The monthly trend showed that the index reached 144.5 in January 2026 before declining to 131.7 in February, 124.96 in March and 114.56 in April.
Automobiles lead cumulative growth
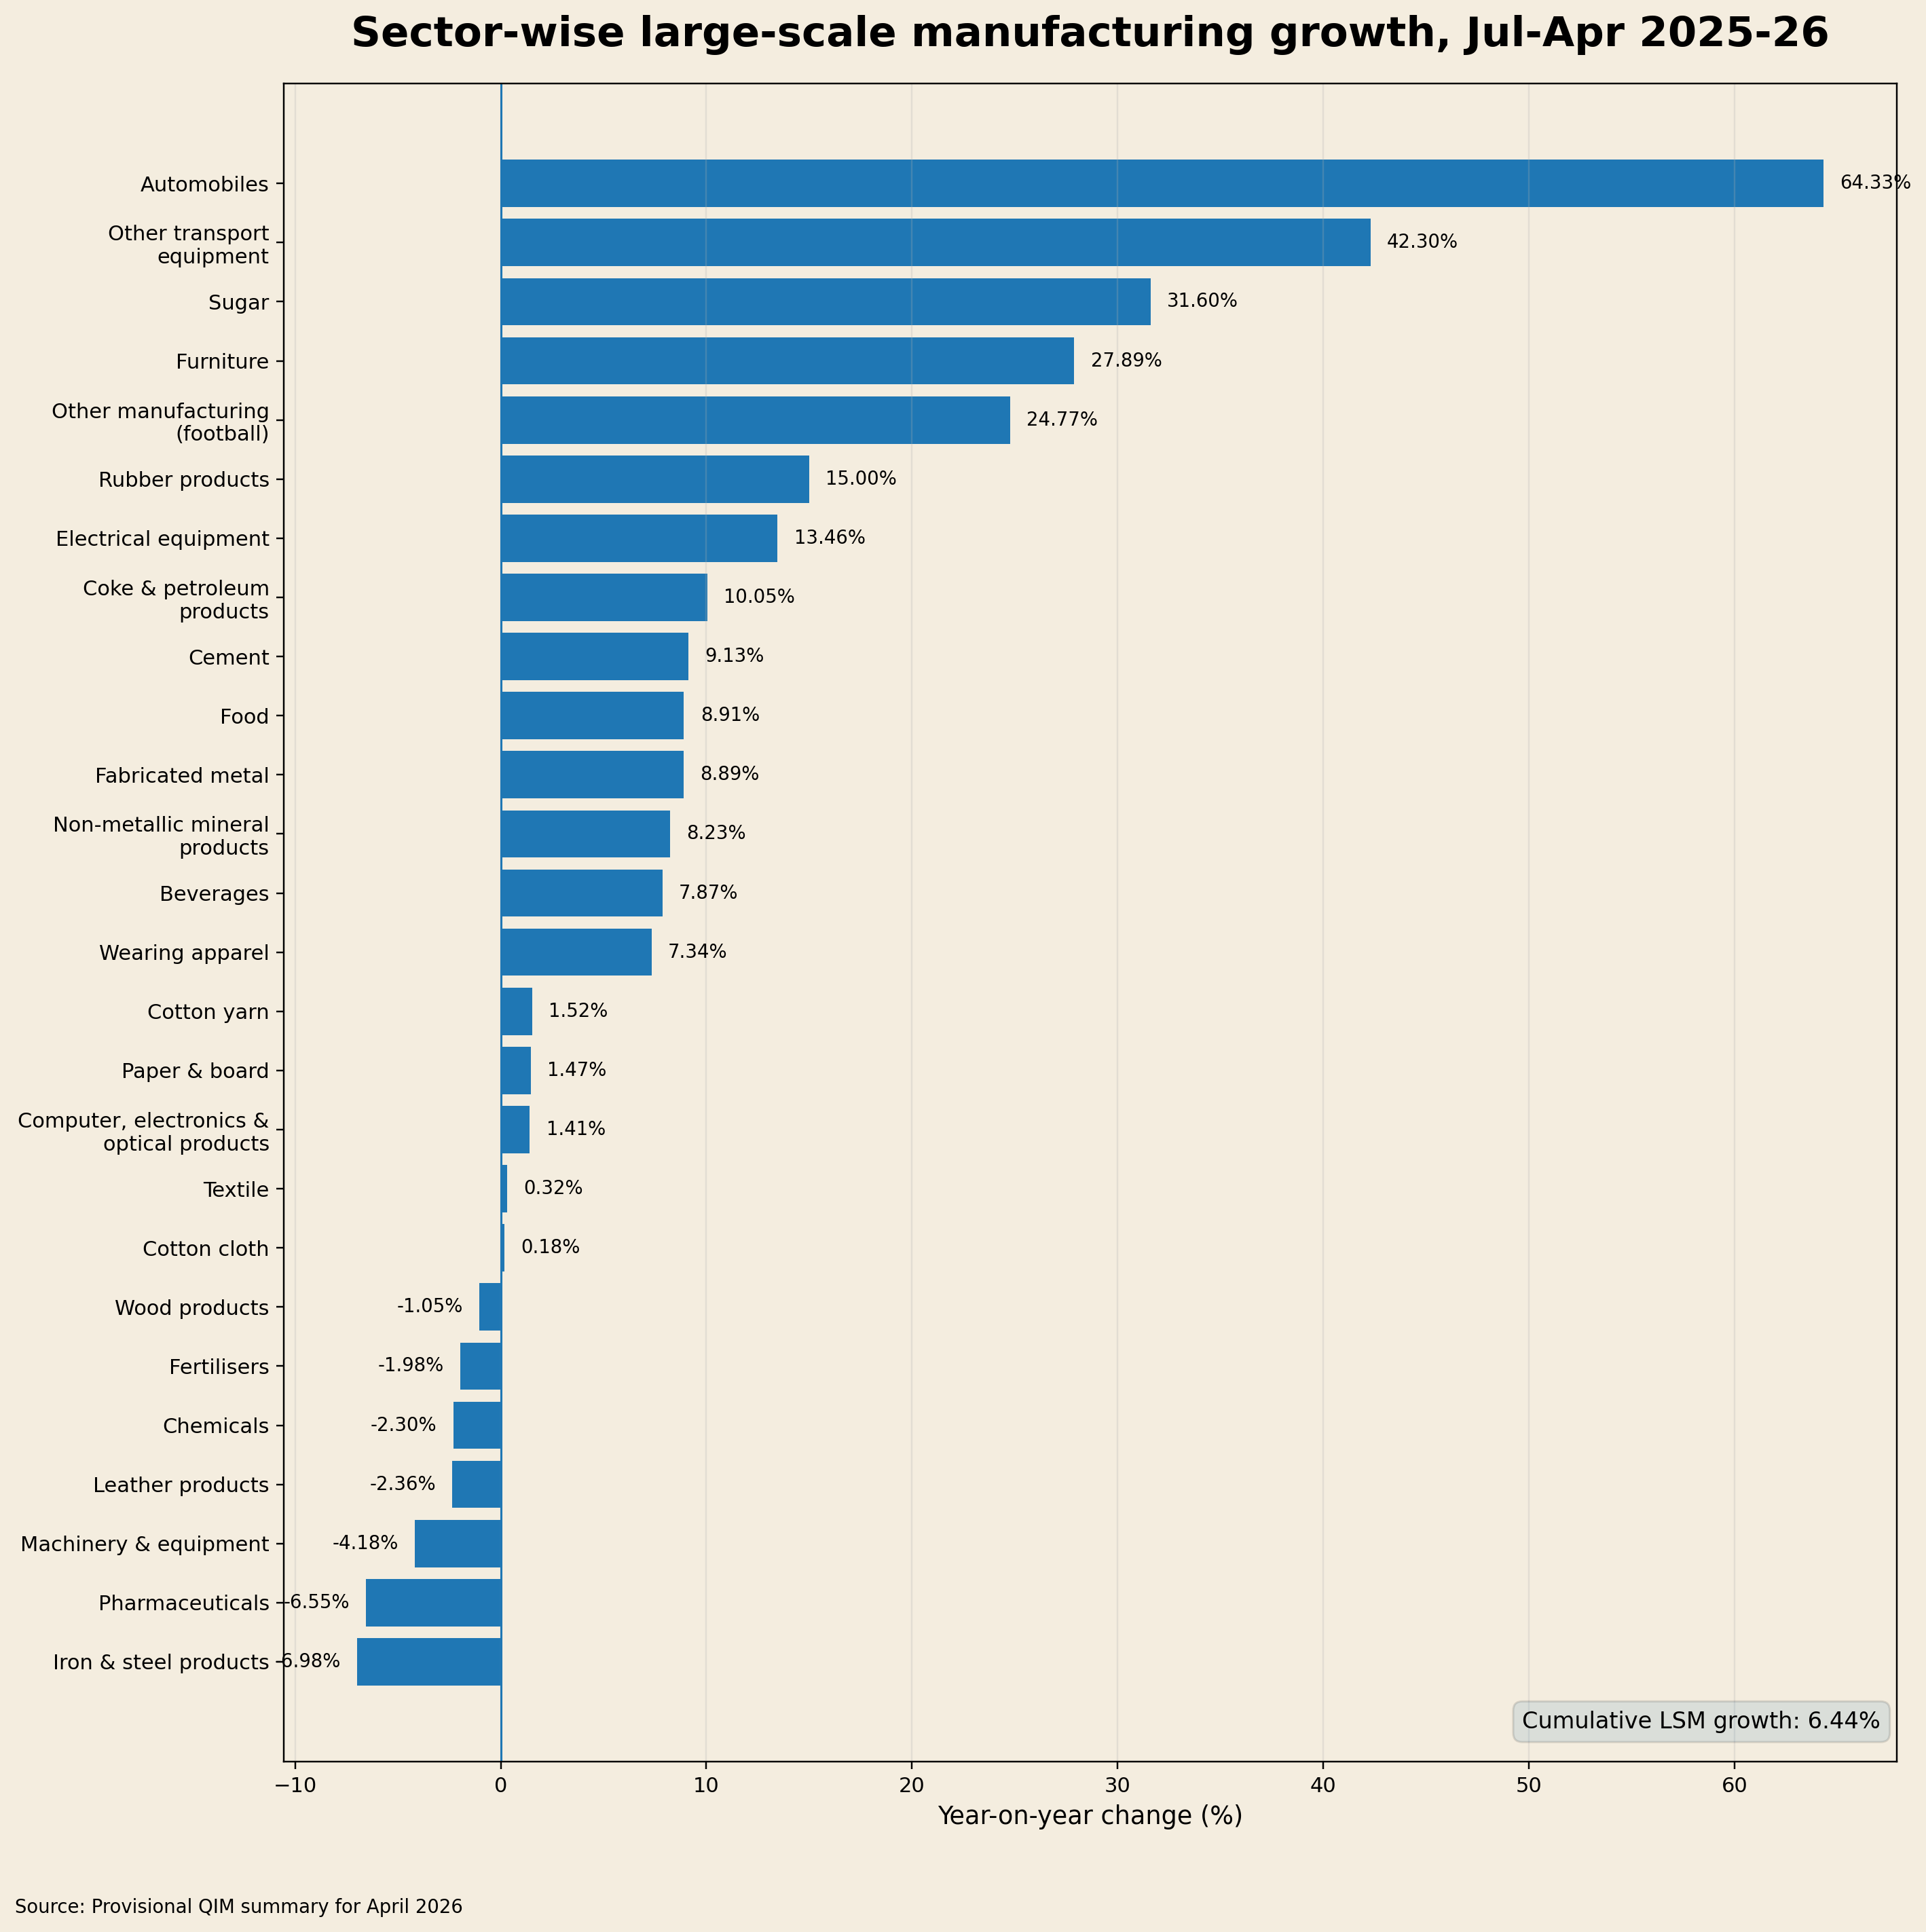
Automobile production recorded the largest increase among the main manufacturing categories, rising by 64.33% during July-April FY26 compared with the same period last year.
Automobile output also increased by 83.88% in April compared with April 2025.
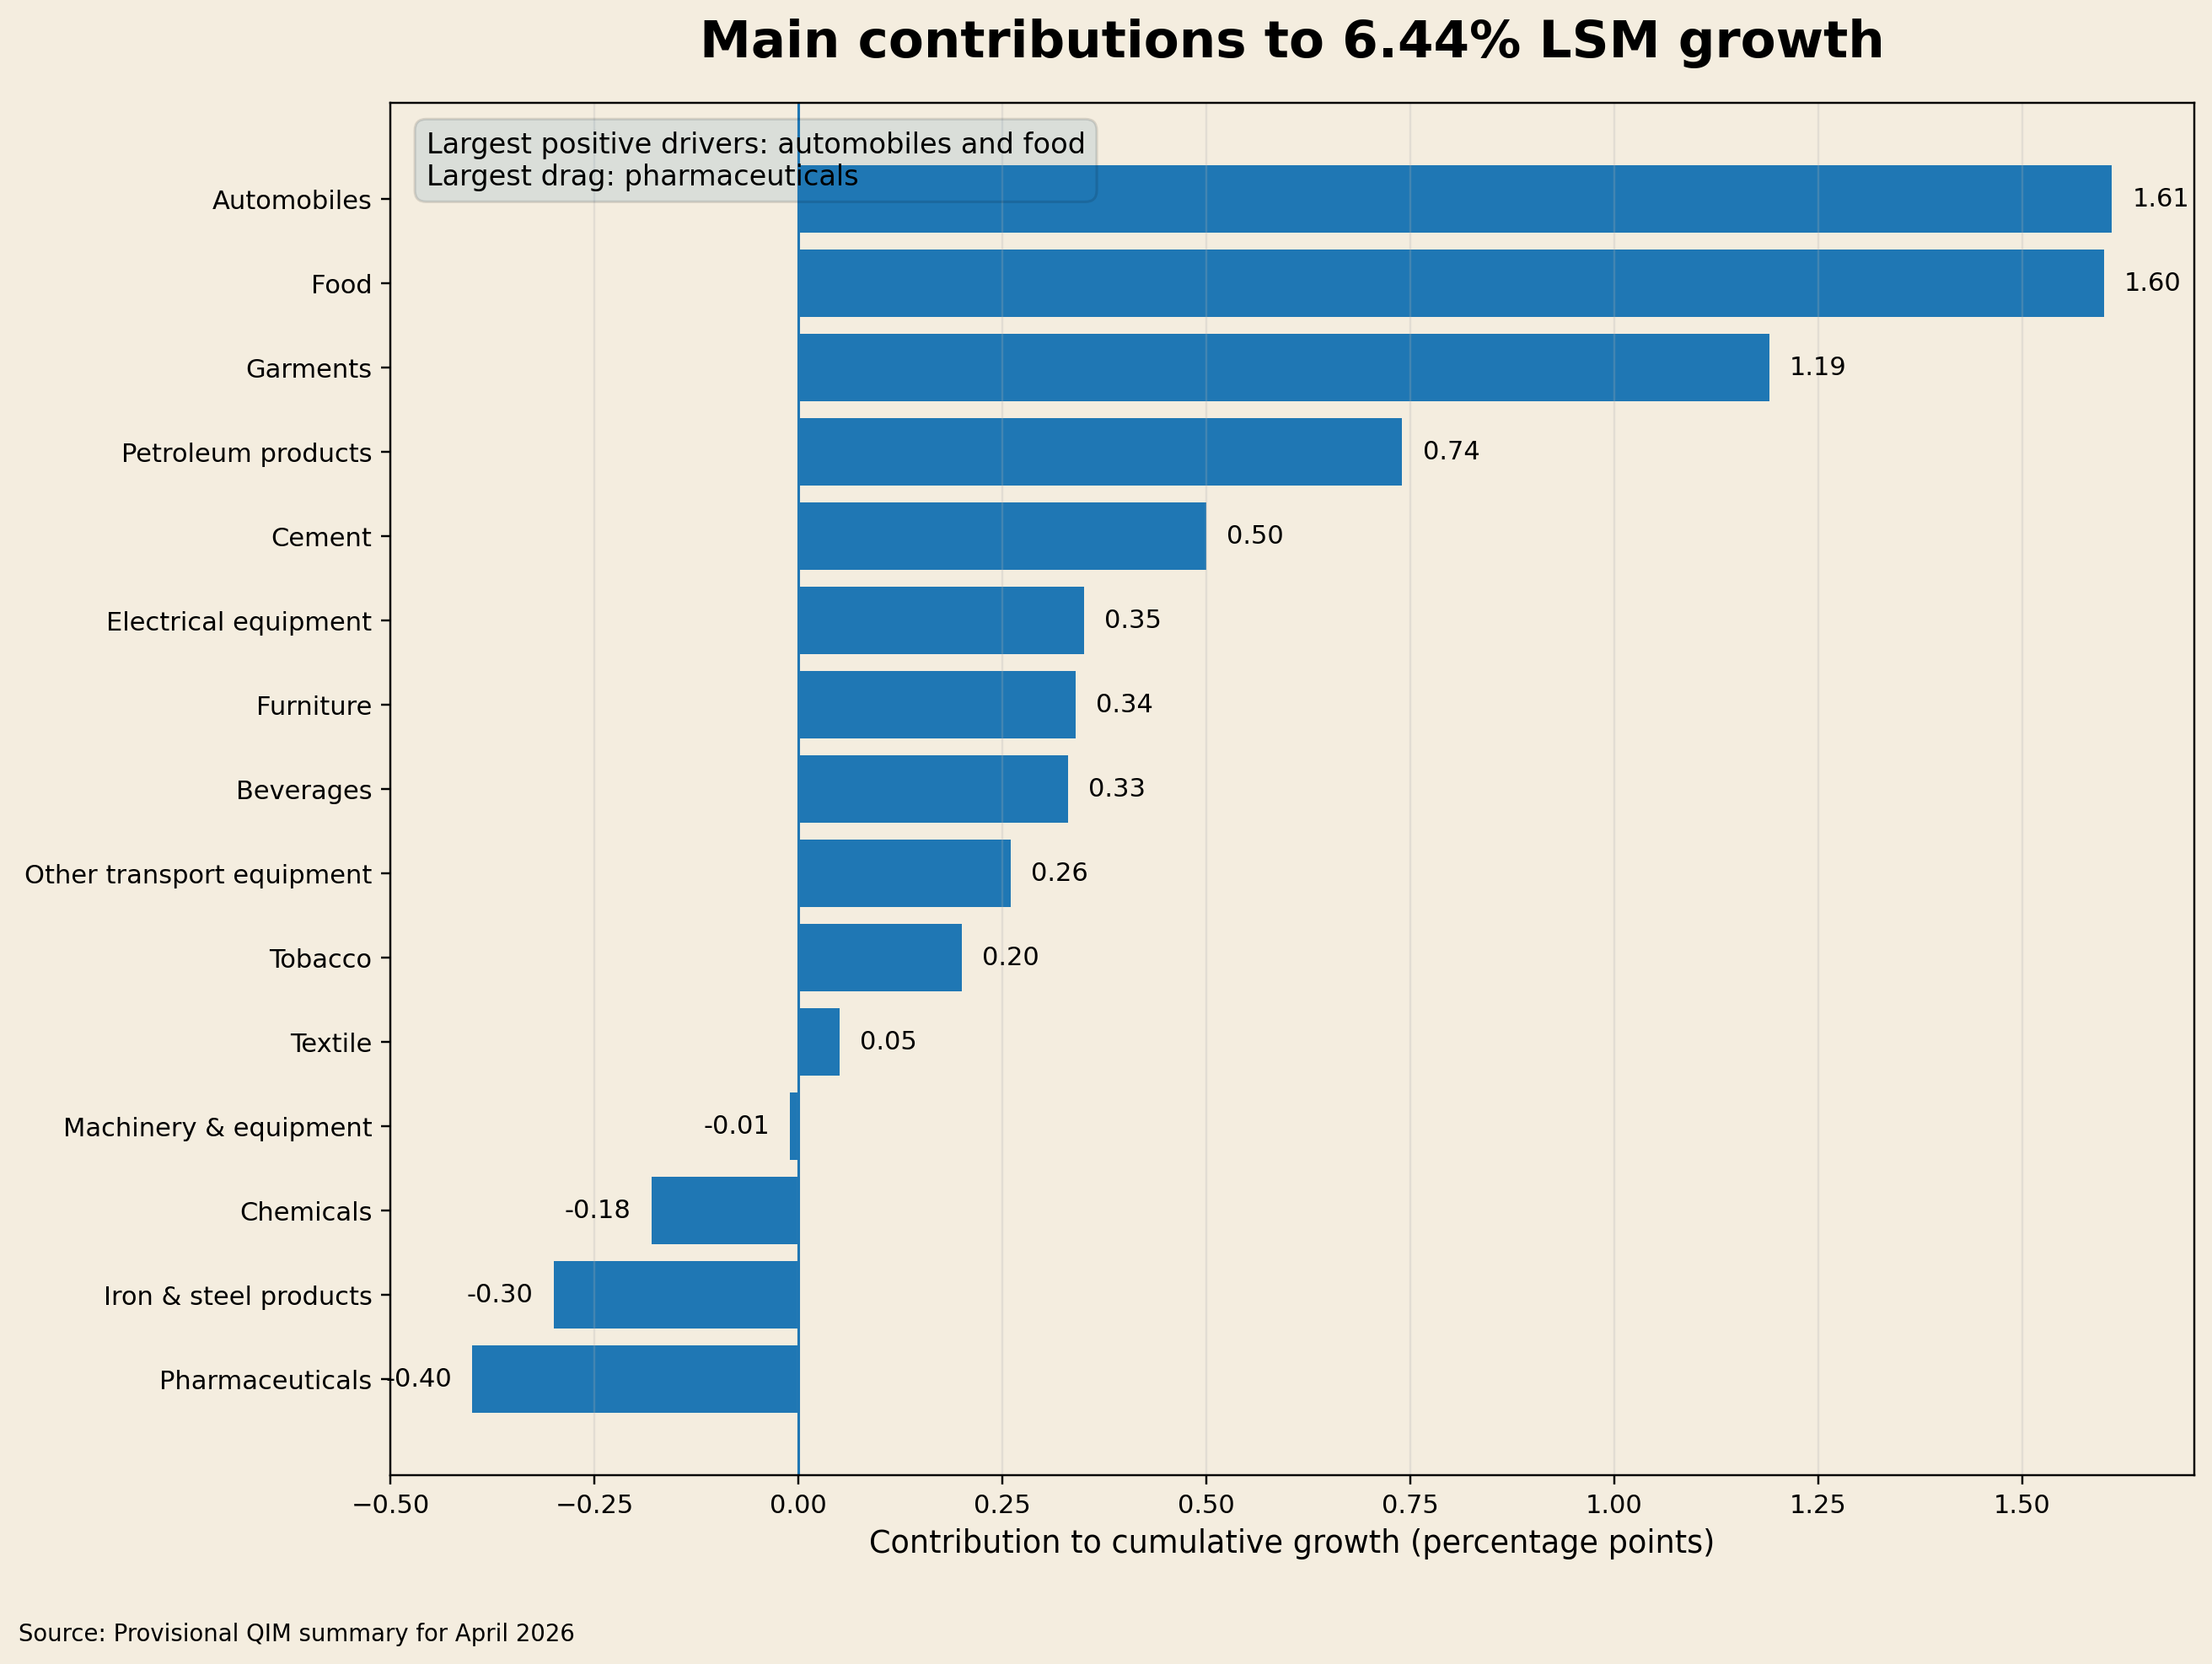
The sector contributed 1.61 percentage points to the overall 6.44% increase in large-scale manufacturing, making it the largest positive contributor.
Other transport equipment output rose by 42.30% during the 10-month period and by 57.19% in April. Its contribution to cumulative manufacturing growth stood at 0.26 percentage points.
Furniture production increased by 27.89% during July-April and surged by 128.26% year-on-year in April. The sector added 0.34 percentage points to overall growth.
Output under other manufacturing, including football production, rose by 24.77% during the 10 months and by 41.47% in April.
Sugar, food production increase
Sugar production increased by 31.60% during July-April FY26 and rose by 359.94% in April compared with the same month last year.
Food-sector production grew by 8.91% during the 10-month period, contributing 1.60 percentage points to overall manufacturing growth.
However, food production declined by 2.11% year-on-year in April, resulting in a negative monthly contribution of 0.29 percentage points.
Beverage output increased by 7.87% during July-April and by 9.34% in April.
Tobacco production rose by 12.74% during the 10 months and by 20.82% in April.
Garment production increased by 7.34% during July-April and by 15.18% in April. The sector contributed 1.19 percentage points to cumulative growth and 2.26 percentage points to April’s annual increase.
Textile output recorded a marginal increase of 0.32% during July-April, despite declining by 3.51% in April.
Cotton yarn production rose by 1.52% during the 10 months but fell by 1.12% in April. Cotton cloth production increased by 0.18% cumulatively and by 0.09% during April.
Petroleum, cement and electrical equipment
Coke and petroleum products recorded production growth of 10.05% during July-April and 3.83% in April.
The sector contributed 0.74 percentage points to cumulative large-scale manufacturing growth.
Cement output increased by 9.13% during the 10-month period and by 9.11% in April, contributing around 0.50 percentage points to overall growth.
Electrical equipment production rose by 13.46% during July-April and by 26.81% in April. Its cumulative contribution stood at 0.35 percentage points.
Non-metallic mineral products recorded growth of 8.23% during July-April and 8.74% in April.
Fabricated metal production increased by 8.89% during the 10 months and by 23.95% in April.
Rubber products rose by 15% during July-April and by 21.48% in April, while paper and board production increased by 1.47% and 14.73%, respectively.
Pharmaceuticals, steel record declines
Iron and steel products recorded the largest cumulative decline among the major sectors, falling by 6.98% during July-April FY26.
Iron and steel output also declined by 12.88% in April, subtracting 0.30 percentage points from cumulative growth.
Pharmaceutical production fell by 6.55% during the first 10 months and by 19.02% in April.
The sector reduced overall manufacturing growth by 0.40 percentage points, making it the largest negative contributor.
Chemical production declined by 2.30% during July-April and by 10.32% in April, subtracting 0.18 percentage points from cumulative growth.
Within chemicals, chemical products declined by 2.88% during the 10-month period, while fertiliser production fell by 1.98%.
Fertiliser output declined by 10.55% in April compared with the same month last year.
Machinery and equipment production fell by 4.18% during July-April, despite increasing by 61.22% in April.
Leather products declined by 2.36% during the 10 months and by 3.41% in April.
Wood products fell by 1.05% during July-April, although output increased by 2.95% in April.
Overall, production increased across 16 broad sectors during July-April, including food, beverages, tobacco, textiles, wearing apparel, petroleum products, automobiles, electrical equipment and furniture.
Declines were recorded in leather, wood, chemicals, pharmaceuticals, iron and steel, and machinery and equipment.
Comments
No comments yet. Be the first to join the discussion!