Despite registering their most dismal half-yearly sales revenue in the past five years — even lower than the pandemic-stricken years — Honda Pakistan, officially known as Honda Atlas Cars Pakistan, has achieved something remarkable. They have amassed their second highest half-year profit over the same period. How did they pull off this feat? The most evident reasons are higher revenue per car, astute timing of their import orders, and the overall recovery of Pakistan’s economic condition. However, a deeper analysis reveals that Honda is operating like a well-oiled machine — no pun intended — based on a five-year time horizon.
Before we commence, it’s important to note that Honda operates on its own market year from April 1 to March 30. Consequently, Honda’s current market year is from April 1 2023 to March 30 2024. It’s September 30, 2023 earnings are thus their half yearly earnings — 1HMY24. Now, back to the numbers.
Honda’s success is hard to spot at first glance. Both its sales revenue and gross profit, at Rs 18 billion and Rs 1.4 billion are the lowest in five years. Its operating profit fares only slightly better coming in at Rs 137 million — it’s second worst in five years. However, beyond this is where Honda’s misery comes to an end as the company’s final profit clocks in at Rs 820 million — it’s second highest in the past five years.


So, how has Honda managed to metamorphose a modest operating profit into its second loftiest net profit? By slashing its exchange losses, and boosting its investment income. At Rs 234 million, Honda recorded its second lowest ‘other expenses’ for our select five year period— a feat only outdone during the pandemic-induced lockdowns.
But what exactly are these ‘other expenses’? This is the ledger where Honda notes its exchange losses, the very same losses that wreaked havoc on its financials last year when Pakistan was rationing letters of credit to importers.
How did Honda manage to rein in its exchange losses? The company rarely comments on them unless they are, of course, tearing their financial performance to shreds. The most plausible explanation is Pakistan’s acceptance of the International Monetary Fund’s stand-by agreement, leading to a relaxation of import restrictions. Additionally, the stability of the Pakistani Rupee from July to September, compared to the volatility from March to June, might have enabled Honda to execute their import orders more effectively.
If we were to indulge in a bit of speculation, we could surmise that Honda might have even created a buffer stock, a lesson learned from the trauma of exchange losses it endured last year. Why do we suggest this? It currently has a surplus stock of its HR-V and BR-V line of vehicles that it needs to shift — an unusual situation given that the company operates on a just-in-time model for its vehicles, manufacturing them only once orders are placed to avoid excess inventory at all costs. However, this is purely conjecture.
Read more: Lucky Motors, and Honda might just upend the auto finance market even if it’s just for a few months
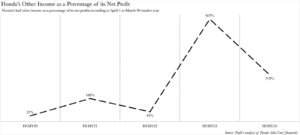
Beyond the reduction in exchange losses, Honda’s bottom line has been fortified by the ‘other income’ it has garnered. At Rs 1.8 billion, Honda’s ‘other income’ has reached a five-year high on a half-yearly basis. ‘Other income’ is essentially a catch-all term for the investment income that Honda earns. This includes, but is not limited to, profit on bank deposits, interest on loans to employees, unwinding of discount on long-term trade debts and loans to employees, gain on financial assets, gain on disposal of property, plant and equipment, and markup on advances to suppliers.
While ‘other income’ might be the highest in nominal terms, relative to Honda’s final profit it’s the second highest across the period at 219% compared to 1HMY23’s 482%.

However, these conspicuous improvements across Honda’s bottom line mask the fact that the company has enhanced its operations in numerous subtle ways. These operational enhancements, though less visible, are no less significant in contributing to Honda’s financial success.
The well oiled profit churning machine Honda’s come out as
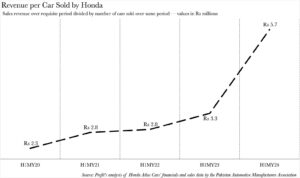
Honda’s abysmal sales revenue is emblematic of the collapse that it’s witnessed across its four wheeler lineup. The reduction in sales revenue, however, does not capture the collapse in its sales. This is because whilst its sales revenue fell by 79% year-on-year, its sales revenue only contracted by 64% over the same period. Honda’s real win comes when we look at the sales revenue generated in terms of per vehicle sales.
In this respect, Honda has ascended to a five-year high. Revenue per vehicle sold skyrocketed to an unparalleled high of Rs 6 million. How did Honda pull off this feat? The most likely explanation is the series of price increases that Honda, like other automotive manufacturers, has put into effect. However, more importantly, Honda has overhauled its entire vehicle lineup, with both its City and Civic models undergoing a facelift in 2021 and 2022 respectively. Furthermore, Honda also introduced its first crossover sub-compact utility vehicle in the form of the HR-V.

We have previously dissected the performance of Honda’s HR-V, however, as a percentage of Honda’s total sales, the BR-V/HR-V joint category has swelled to 35% of Honda’s total sales. This represents an unprecedented high for the category. The category’s surge in relative sales is also a probable contributor to Honda’s leap in average revenue per car, with both the BR-V and HR-V boasting heftier price tags than Honda’s baseline City.
Read more: If Honda has any tricks up its sleeves, this might be the time to pull them out
Raking in higher revenue per vehicle sold, rather than nominal revenue, and also maximising investment income, characterises Honda’s performance for its H1MY24 figures. A cursory examination of the figures might portray Honda’s net profit as the company’s sole standout achievement. While that is indeed the case, and we have endeavoured to explicate how Honda accomplished this, the company’s nominal figures obscure the extent to which the company has excelled on its current smaller scale.
Honda’s gross profit margin for H1MY24 is the second highest across the five-year period, with its net profit margin registering as the highest it has been over the past five years. It’s only Honda’s operating profit margin that tarnishes the company’s record in terms of these metrics, as it registers as the second lowest over the span of the past five years.


