


Ever since the coronavirus pandemic began its global assault in early 2020, scientists across the globe have been working against the clock to find a vaccine. Simultaneously, there has been a barrage of Covid19 data that has flooded the internet. While this proliferation of information online may help enhance our understanding of the disease, lack of standardization in compiling and reporting the data means it is tough to compare certain figures across geographies.
As such, we need to take any Covid-19 data with a grain of salt. With that disclaimer laid out upfront, this article delves into one of the earliest theories surrounding the coronavirus: it does not thrive in hot weather. While most, including a number of world leaders, took this as a general caveat that meant the situation would improve in the northern hemisphere as the warmer months approached, it has played out a little differently.
The available data indicates that higher temperatures (above a certain threshold) have had a slowing effect on Covid-19, but this has been seen across geographies more than across seasons. The winner of this “weather lottery” has been one fortunate corridor stretching from north-west Africa to South Asia, which includes Pakistan. This might explain why the crisis has been managed to a degree despite the lackluster adherence to the government’s social distancing guidelines and standard operating procedures (SOPs).
So what exactly does the data indicate? It appears that an average temperature above 32 Celsius for a sustained time period of roughly 4 weeks might lead to a reduction in Covid-19 cases. Analysis over a time period of four weeks is warranted as the virus could have an incubation period of up-to two weeks, after which the infected individual may develop symptoms. The four-week time period takes care of the incubation period along with any lags in testing and reporting of national results.
Additionally, the analysis only covers countries that have reported at least 1,500 total cases over the 28 days ended August 7, 2020. The weather data has been sourced from the National Oceanic and Atmospheric Administration (NOAA) and the Covid19 data is sourced from John Hopkins’s COVID19 data repository.
Relationship between temperature and Covid-19 growth
In the following chart, the y-axis represents the average temperature over the 28 days ending August 7, 2020. The x-axis represents growth in total Covid-19 cases over the 28 days ending August 7, 2020 compared to the prior 28 days.
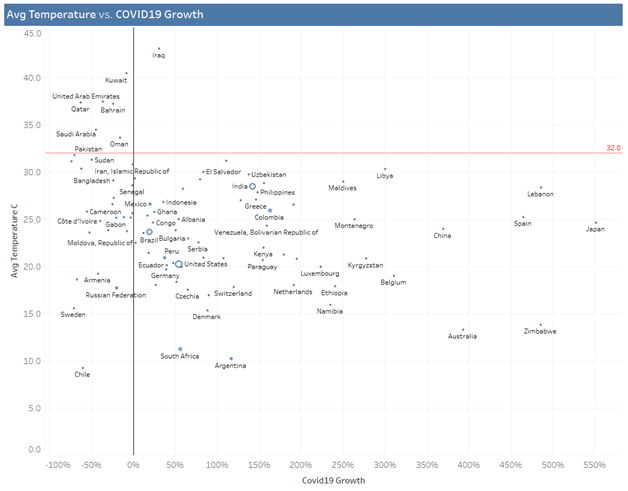
The relationship between average temperature and growth in Covid-19 cases has given us one very important number: 32 Celsius. Data taken from countries that have reported at least 1,500 cases in the past 28 days shows that countries with temperatures lower than 32 Celsius have all had varying coronavirus growth rates. Many have seen a reduction in Covid-19 cases, either due to reduced testing or more stringent SOPs. However, many more have seen drastic rises in Covid-19 cases, with some countries seeing increases of up to 550%.
This means that up until the 31-32 Celsius point, the growth or reduction of coronavirus cases depends on the measures that any country decides to take. However, for countries that have had an average temperature of more than 31-32 Celsius over the course of these four weeks, every single country except Iraq has seen a reduction in Covid-19 cases. Pakistan, Iran, Saudi Arabia, Kuwait, Oman, Bahrain and the UAE have all seen a reduction, and a number of countries on the border of the 32 Celsius line, such as Bangladesh and Sudan, have also seen a dip in cases.
Even in the case of Iraq, the only country experiencing a rise in cases despite an average temperature of more than 32 Celsius, there is a data discrepancy. The NOAA provides sporadic data for Iraq and only includes a single location (Kut-Al-Hai), which means this average temperature may not be representative of the entire country of Iraq.
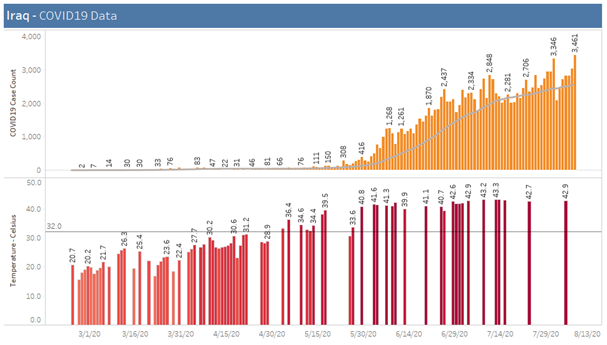
NOAA’s Weather data for Iraq is spotty and cover only a single town, Kut-Al-Hai
This is the clearest conclusion we can draw from the available data about hot weather and its effects on the growth of the coronavirus. But what other factors could have contributed to the reduction in cases in these countries? It simply cannot be a case of just the hot weather, especially since there are countries witnessing declines at much lower temperatures, such as Chile at an average temperature in single digits. Let us look at a few exhibits for countries that lie in the top left corner of the scatter plot presented earlier, and in that “weather lottery” corridor.
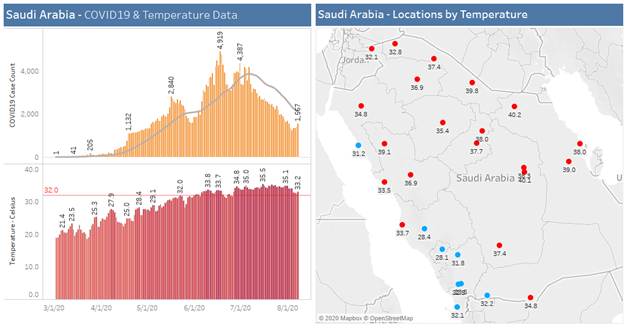
Saudi Arabia
Over the 28 days that ended on August 7, Saudi Arabia had 59,307 new cases of Coronavirus, representing a reduction of -44% over the prior 28 day total of 106,544. During the last 28 day period, the average temperature around the country was approximately 34.5 Celsius. Moreover, the country was warm pretty much all over as there were no great geographic variations in temperature (the map below on the right side shows the 28-day average temperature for various locations in Saudi Arabia).
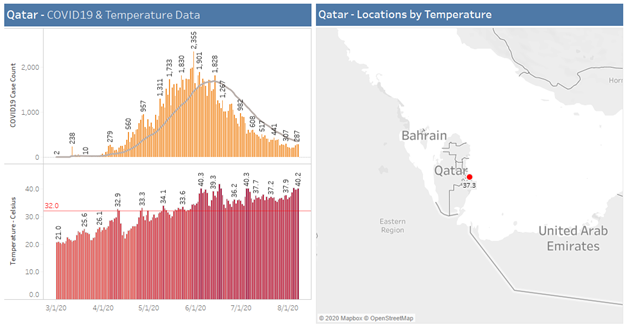
Qatar
Qatar is a small country with significantly fewer cases than Saudi Arabia, but it represents the same pattern of declining cases with high temperature levels. Over the 28 day period being analysed, Qatar had 9,753 new cases of Coronavirus, representing a reduction of -63% over the prior 28 day total of 26,042. During the last 28 day period, the average temperature around the country was approximately 37.3 Celsius. It is also noteworthy that the NOAA provides temperature data for a single location in Qatar. However, given the country’s small size this might not be an issue.
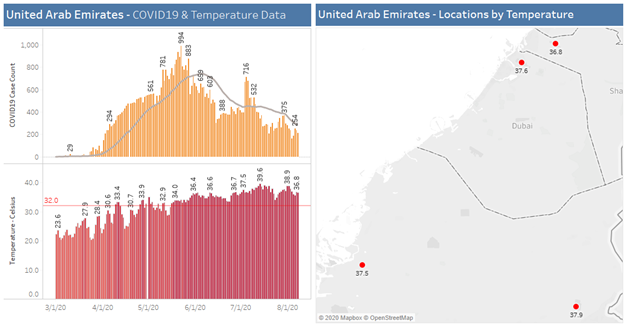
United Arab Emirates
The United Arab Emirates also fits our pattern of high temperature coinciding with declining case counts. The trailing 28-day sum as of August 7, 2020 was 8,011 cases, which was -36% below the prior 28-day total of 12,551 cases. During the trailing 28 days, the average temperature across the country was 37.5C.
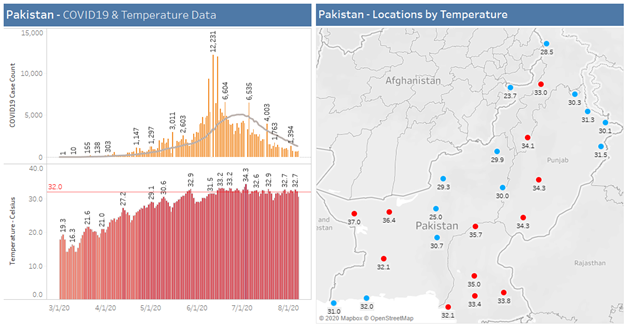
Pakistan
While the average temperature in Pakistan over the trailing 28-days ending August 7, 2020 has been approximately 31.8 Celsius, which is slightly shy of the 32-degree threshold, it is noteworthy that 32 Celsius is not a miracle threshold but an estimation. Additionally, there are numerous populous locations, such as Lahore, where the average of the trailing 28-days average is shy of 32 Celsius but not by much. The trend of declining cases is the same.
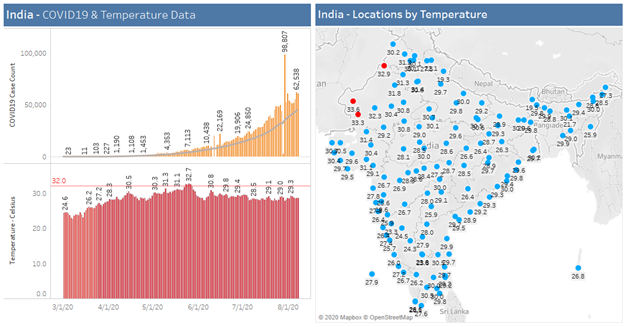
India
While the general perception is that India’s climate is quite similar to Pakistan’s, a deep dive into the temperature map shows that the “weather lottery” runs out in northwest India, with the rest of the country experiencing much milder average temperature.
Relationship between mobility and Covid-19 growth
There is clearly a relationship between higher average temperatures and declining coronavirus cases. However, since this is not a scientific study or a conclusive analysis, it is important to look at whether or not there are other factors that have allowed the countries above the 32 Celsius mark to decrease their Covid-19 footprint. After all, there are plenty of countries well below the 32 Celsius threshold that have also seen impressive declines.
There are also fewer countries that fall in the above 32 Celsius range, and the Iraq anomaly still exists. The question then becomes, how do we know that the reduction in Covid-19 growth in the above-mentioned countries is not attributable to social distancing? That is a very valid line of inquiry, and an exploration of Google’s Covid-19 Community Mobility Reports sheds some interesting insights.
The Community Mobility Reports is an attempt to aid public health officials across the world with their response to the pandemic, by anonymously aggregating the individual user’s location data into six statistics. These are grocery and pharmacy, parks, transit stations, retail and recreation, residential, and workplaces.
The aggregate indices show how visits and lengths of stays at different places change relative to a baseline, which is the median value for each weekday during a 5 week period from January 3 to February 6, 2020.
However, as Google itself has explained, there are some important factors to keep in mind when using this data to analyse the on-ground situation. For example, it is important not to compare the change in the residential category with other categories because they have different units of measurement. There are also other considerations, such as avoiding comparisons across regions, because local differences in the data can be misleading.
Essentially, because location accuracy and the understanding of categorised places varies from region to region, Google does not recommend using this data to compare changes between countries, or between regions with different characteristics, which they are bound to be.
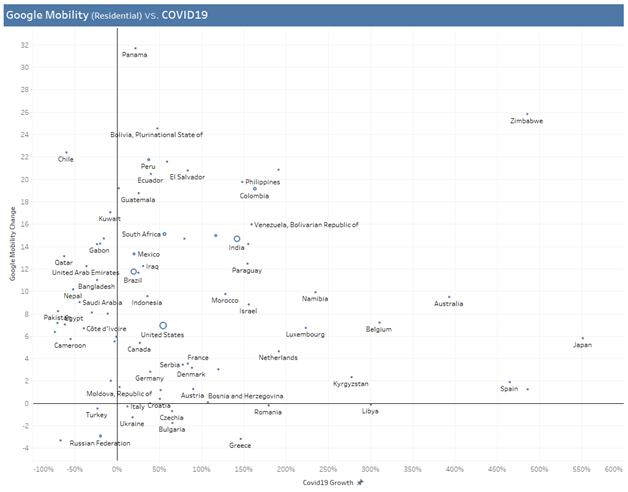
The y-axis represents the average Google Mobility Index (Residential) over the 28 days ending August 7, 2020 and the x-axis represents the growth in total Covid-19 cases over the 28 days ending August 7, 2020 compared to the prior 28 days.
This means that based on Google’s own recommendation, it is unwise to compare countries on the level of change in Google Mobility Index for any category. However, this does not mean it is completely obsolete for us. We could, for example, look at the relationship between a country’s change in Google Mobility Index (Residential) and the change in Covid19 cases in that country. It is not an outrageous expectation that if “at home” time increases, then greater social distancing would lead to a reduction in Covid19 cases – a statement that does not hold true for a vast number of countries (in the top right quadrant in the exhibit above). This does not mean that social distancing does not help. For all we know, had people not worn masks and not stayed at home, then Covid19 growth would have been even higher.
Opinions from academic / scientific research
This article is not a vetted academic paper and there are numerous shortcomings in the data being used. However, the article highlights an important correlation, not necessarily causation, but certainly correlation. This relationship is in-line with findings of various academic and scientific studies that suggest that Covid-19 dies much faster under higher temperatures, and possibly also under greater sunlight and humidity.
For example, in an academic paper called “High Temperature and High Humidity Reduce the Transmission of COVID-19”, published back in March, a group of professors from universities in China and the US concluded that higher temperature and higher humidity led to a reduction in the “effective reproductive number,” commonly known as the ‘R’ value.
There are similar results from studies that are based on laboratory tests. A paper called “Airborne SARS-CoV-2 Is Rapidly Inactivated by Simulated Sunlight”, published in June in the Journal of Infectious Diseases, concluded that sunlight might be the key to Covid-19 decay rate. According to these researchers, simulated sunlight rapidly inactivated the virus in aerosols in either suspension matrix, with half-lives of less than 6 minutes and 90% of the virus inactivated in less than 20 minutes for all simulated sunlight levels tested.
The later study highlights the importance of distinguishing between the ever-confusing “causation and correlation”. While the data presented earlier in this article shows a drop-off in Covid-19 growth when average temperature breaches 32C, it could very well be the case that it is sunlight that actually causes the reduction in Covid-19 growth, and sunlight just happens to be present when temperature is warm.
Conclusion
Did Pakistan really win the temperature lottery? Is high temperature truly the trump card when it comes to battling the pandemic? If so, then how should our country prepare for the colder temperature (or winter fog that blocks sunlight) in the months ahead? As Pakistanis, along with the rest of the world, continue our struggle to find a balance between saving lives and livelihoods, it is important to understand that we must not let our guard down and continue to adhere to Covid19 SOPs, which include wearing masks.
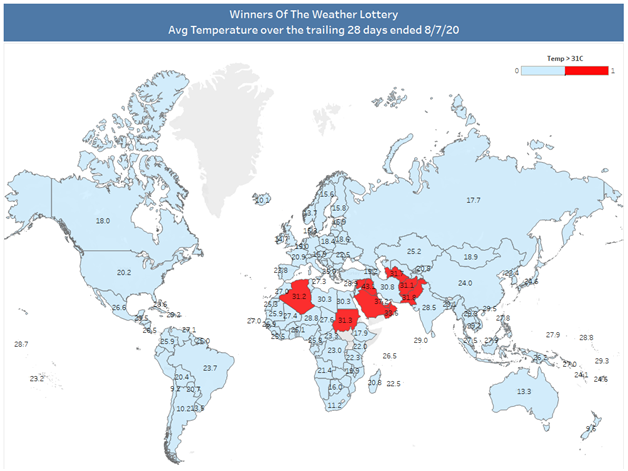
Winners of the Weather Lottery: average temperatures over the 28 days ending August 7, 2020
Incidentally, this analysis is based on the average temperature at each location during the day. For Covid19, it can be argued that the more important metric is the maximum temperature during the day as it probably requires a few hours or few minutes of high temperature (or sunlight) to kill the virus. However, NOAA’s weather data for maximum temperature is sporadic, with lower coverage in terms of both locations and dates.


What are the correlation coefficients of covid19 growth and temperature? Is the value statsitically significant?
*Statistically.
I did not test for significance because I do not know if the relationship between temperature and Covid19 growth is linear. There may be a threshold temperature above which Covid19 essentially dies. The above analysis is based on average temperature (due to lack of data) but it is likely the high temperature of the day that kills the virus. In other words, the blistering ~40C+ temperature during the mid-day summer months likely killed the airborne virus and hence reduced the spread.
The following paper (and others like this) have tested for significance and published their findings in peer-reviewed academic journals.
https://papers.ssrn.com/sol3/papers.cfm?abstract_id=3551767
You are welcome to track daily changes in temperature and Covid19 growth using the following dashboard:
https://bigbyteinsights.com/covid19