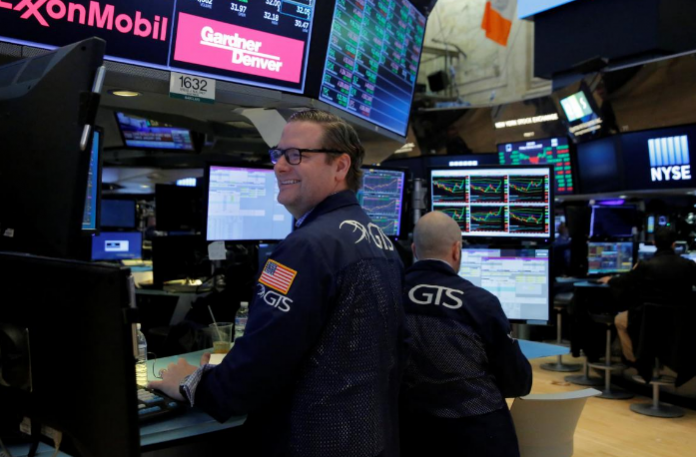
NEW YORK: Stock investors on Monday will be seeking to divine if the deepest weekly slide since January 2016 will continue or if the market will turn the corner after one of the most volatile five days in years.
Equal parts science, art and luck may be needed to pick a bottom in the S&P 500. While it ended last week on an up note, the index was caught in its first correction in two years, after a 7 per cent rally this year that culminated with a record high on January 26, following a 19 per cent 2017 gain.
While Wall street experts caution that it is difficult to definitively pinpoint a turning point, several said they will monitor a number of indicators that could help show if the selloff has ended.
“People sometimes get pulled into wanting to call tops or bottoms,” Instinet Chief Market Technician Frank Cappelleri said. “I would say it is almost impossible to do that, especially on a continued basis, but I think identifying patterns when they develop can at least give you a sense that things are turning just a bit.”
Wall Street’s main stock indexes climbed more than 1 per cent on Friday, giving investors some solace after a week of huge swings that shook the market out of months of calm.
Even with Friday’s gains, the benchmark S&P 500 fell 5.2 per cent for the week, its biggest weekly percentage drop since January 2016, as volatility spiked.
“You want to see that less stocks are making new lows even if the whole market is down,” Suntrust Advisory Services Chief Market Strategist Keith Lerner, said in an email.
In one positive sign on Friday, 65 per cent of S&P 500 stocks made new 20-day lows, compared with 79 per cent on Tuesday, Lerner said.
“What you want to see eventually is strong buying. You want to see multiple days where 90 per cent of the volume is positive (stocks that are rising,)” he said.
Cappelleri is watching for pockets of strength. “That’s step one: seeing the bleeding stop, at least for a few different areas or groups. And then from that point we can see if that broadens out a bit,” he said.
Better performance of economically sensitive sectors such as financials could be a sign that investors are becoming less bearish. “When people feel better about the market you don’t want to see utilities lead,” Lerner said.
“Any final flush for US equity markets has to pull this group much lower and very quickly,” said DataTrek Research Co-Founder Nicholas Colas. “One big reason we don’t think US stocks have bottomed: this hasn’t happened yet.”
The S&P 500 technology index .SPLRCT led market gains in 2017, rising 36.9 per cent for the year. The technology index is down 0.28 per cent so far this year, while the S&P 500 .SPX is down 2.02 per cent.
The market’s fear gauge, the CBOE Volatility Index .VIX, known as the VIX, has spiked in recent days and earlier last week hit its highest level since August 2015. “I’d like to see the VIX tamed and move back to the lower end of its trading range,” said, BB&T Wealth Management Senior Vice President Bucky Hellwig.
Colas said “It is a declining VIX (often over weeks, not days) that sets the floor for stocks, not a peaky top. So even if this week was the high water mark for the VIX in this correction, we may well see stocks slip further.”
In the months before the selloff, the VIX was trading between about 10 and 13, well below its long-term average of 20. It closed Friday at 29.06.
An increase in bond yields has been seen as a catalyst for the selloff, presenting investment competition to equities at a time when stock valuations are expensive. “If we see some stabilising in interest rates and bond yields in particular, that would seem to indicate what’s going on there has settled down,” Hellwig said.
US benchmark 10-year Treasury note yields US10T=RR early last week surged to 2.885 per cent, the highest level since January 2014.
Jim Paulsen, chief investment strategist at The Leuthold Group in Minneapolis, is looking for “full-on panic.” There has been no sign of investors rushing into safe havens such as gold, US Treasuries and the dollar.
“To find the end you need to see evidence that it truly has convinced people it’s going to go down more, or there’s panic,” Paulsen said. “And I just haven’t seen that yet, at least in behaviour.”
Vincent Catalano, global macro strategist at Blue Marble Research in New York, is watching a key indicator of market momentum known as the moving average convergence divergence line, or MACD. “When the line starts to flatten out, that’s an indication that the pressure is ending, that we’ve reached the short-term bottom,” Catalano said. MACD is a momentum oscillator widely followed by chartists that is based on the relationship between moving averages.
In the most recent bull market’s pullback, the 200-day moving average of the S&P – currently at 2,539 – has been tested, said Brad McMillan, chief investment officer of Commonwealth Financial Network in Waltham, Massachusetts. On Friday, the S&P 500 briefly dipped below that level before rebounding. “That’s typically what we’ve seen in past market cycles. It’s stopped and bounced around at that point,” McMillan said. But if the S&P 500 were to sustain losses below that mark, he said, a “big round number,” such as 2,500, would be the next support level he would look for on the S&P.


[…] NEW YORK: Inventory buyers on Monday will likely be searching for to divine if the deepest weekly slide since January 2016 will proceed or if the market will flip the nook after one of the vital unstable 5 days in years. Equal elements science, artwork and luck could also be wanted to select a backside within the S&P 500. Read More […]