


We will continue with the theme discussed in my first column; distribution of national income. There are different ways of studying distribution of national income in an economy. Before I elaborate let’s understand how national income or GDP can be divided among people. We know that people earn their incomes in different ways in an economy. Most people we know work for somebody else. They provide their labour to firms, and in return earn wages and salaries. Then there are some who own their own firms and earn profits. There is also a third kind, called rentiers. They neither work nor own a firm but live off on rental income. For simplicity we assume that we are considering an economy that only has workers and owners of firms. How do people earn their income in this simple economy? Well, workers earn a wage from the firm they are employed at and firm owners or capitalists receive profits. Collectively these two i.e. workers’ wages and capitalists’ profits add up to make the national income or the GDP. So we can say that GDP of an economy can be divided into two parts – the wage part consisting of the sum of wages received by all the workers and the profit part comprising the sum of all the profits earned by the total number of firms in the economy. Let’s call them wage share and profit share. Since they are shares out of the GDP therefore if we know one, we can easily calculate the other by simple subtraction.
Another way of studying income distribution is to divide all households in an economy in equal income groups. For example a decile would have 10 equal groups and a quintile would consist of 5 equal groups. In my first column I talked about how much of the national income was owned by the top 20% of the households in Pakistan. I had quoted a study that investigated income distribution in the Pakistani economy. Both methods have their pros and cons. For instance, top 20% households would have both high salary earners as well as high profit earners. Wage and profit shares on the other hand tell us the distribution of income between the two factors of production. Wage share would include both high and low income earners just the same way profit share would include high and low profit making firms. But importantly, factor shares of income can also tell us something about the conflict between workers and capitalists. Capitalists or firm owners want to earn as much profit as they could, while the workers would want to push for higher and higher wages. Both come from the output that the workers produce. Capitalists and workers can then be thought of trying to capture as big a share of output as they could, respectively. This conflict over output share also tells us the distribution of output between the firm owners and the workers.
Economic theory also tells us a link between wage share and economic activity i.e. whether wage share and GDP are linked. We usually track this by finding a link between growth rates of wage share and the real GDP (real GDP is GDP adjusted for inflation). Normally the causal link runs from the growth rate of wage share to real GDP growth rate.
Figure one below shows the share of workers in national income in Pakistan over the past decade with the real GDP growth rate. Wage share is shown on the left axis while real GDP growth rate is shown on the right axis.
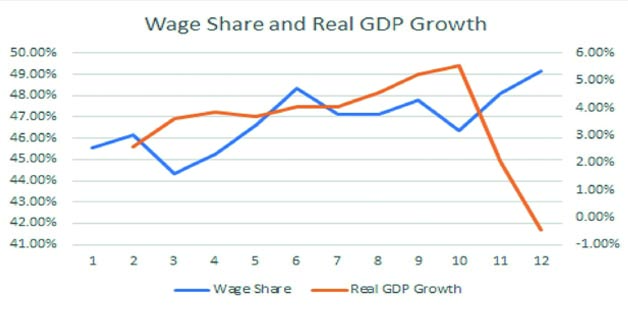
Before I comment on the graph above, a word about the data. Normally, wage share is calculated by data collected in labour force surveys. The idea is that the survey is a thorough exercise that collects information on workers’ earning in different sectors and income levels in the economy. The survey is representative and the data collected can be used to calculate national averages. However, Pakistan’s labour force surveys do not allow us to calculate workers’ wage share directly from the data. The reason being that in Pakistan a large section of the workforce is self employed and/or doing family labour. These categories do not report their income the same way workers employed at a firm would. This makes it difficult to calculate wage share directly. Then there is the added difficulty of the reliability of data. Household income and labour force surveys carried out in Pakistan are known for not collecting data from the upper echelons of income levels. So one has to often take the numbers not just with a pinch, but a bag full of salt. However, despite these difficulties and challenges, labour share of income can still be imputed using different techniques. One such estimation is done by the International Labour Organization (ILO). The data used in figure 1 above comes from the ILO’s modelled estimates. These estimates can vary from year to year depending on the methodology used. For example, I have the most recent ILO numbers and also one from a couple of years ago. The most recent numbers show a higher wage share (higher by 5-6%) for the same year than the previous data! Which numbers do we trust then? But more importantly what does this say about the imputation exercise itself?
As a general thumb rule we can go with the most recent data set. Further, we can assume that the data for each year may not be reliable but the overall trend may be reflective of the actual situation. Like all other social sciences, economic analysis is also constrained by the information available. We just have to make do with what is available rather than what we wish was there!
We can see in the figure 1 above that there is a slow upward trend in the wage share and that it mostly moves between 45% to 50% range. This kind of stability is not unexpected. Wage share’s upward trend post 2008 could be because of increased welfare transfers to the poor after 2008 (BISP and all). Welfare transfers to the workers are counted in their total earnings. It could also mean that the successive increases in the minimum wage levels have contributed towards an upward pressure on real wages despite poor implementation. Note how the wage share rises during the two periods of slow economic growth (2009-2012 and post 2018)) but falls when the economy grows at a higher pace (2013-18). One possible reason could be that when economic growth is slow the profits earned by the firm take an immediate hit, while wages adjust more sluggishly. Similarly, during periods of high growth profit share grows more quickly than wages do. However, one would have to dive deeper into the data to ascertain what’s really going on here. We won’t do that today. Figure 2 below shows the growth of wage share with the growth rate of real GDP below. Wage share growth rate is shown on the left axis and real GDP is on the right axis.
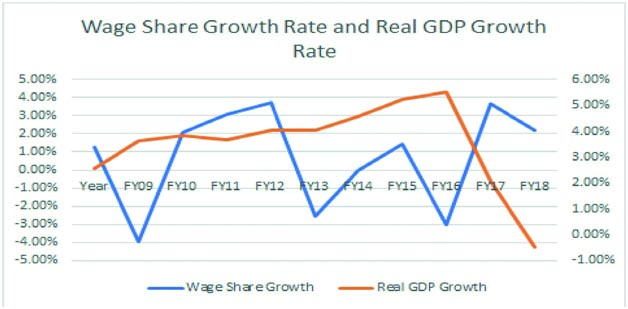
Figure 2: Growth rate of Wage Share with Real GDP Growth Rate
One can see there is a lot more volatility in the growth rate of wage share and there does seem to be a (weakish) link between wage share growth rate and economic activity. However, it is not possible to say whether GDP growth rate causes wage share to grow or vice versa. We would again have to dive deeper into the data to ascertain the causal link here.
In summary, today we tried to learn how studying distribution of national income can be helpful in understanding how the economy behaves. We realised that this distribution may hint at conflict over output between the workers and the capitalists. This conflict has other consequences than just impacting the economy but we will take those up in a future article.


Distribution challenges can indeed be quite frustrating. What specifically are you facing trouble with in your distribution process?
Its a great posting.